2020-12-11 10:44:26 +02:00
|
|
|
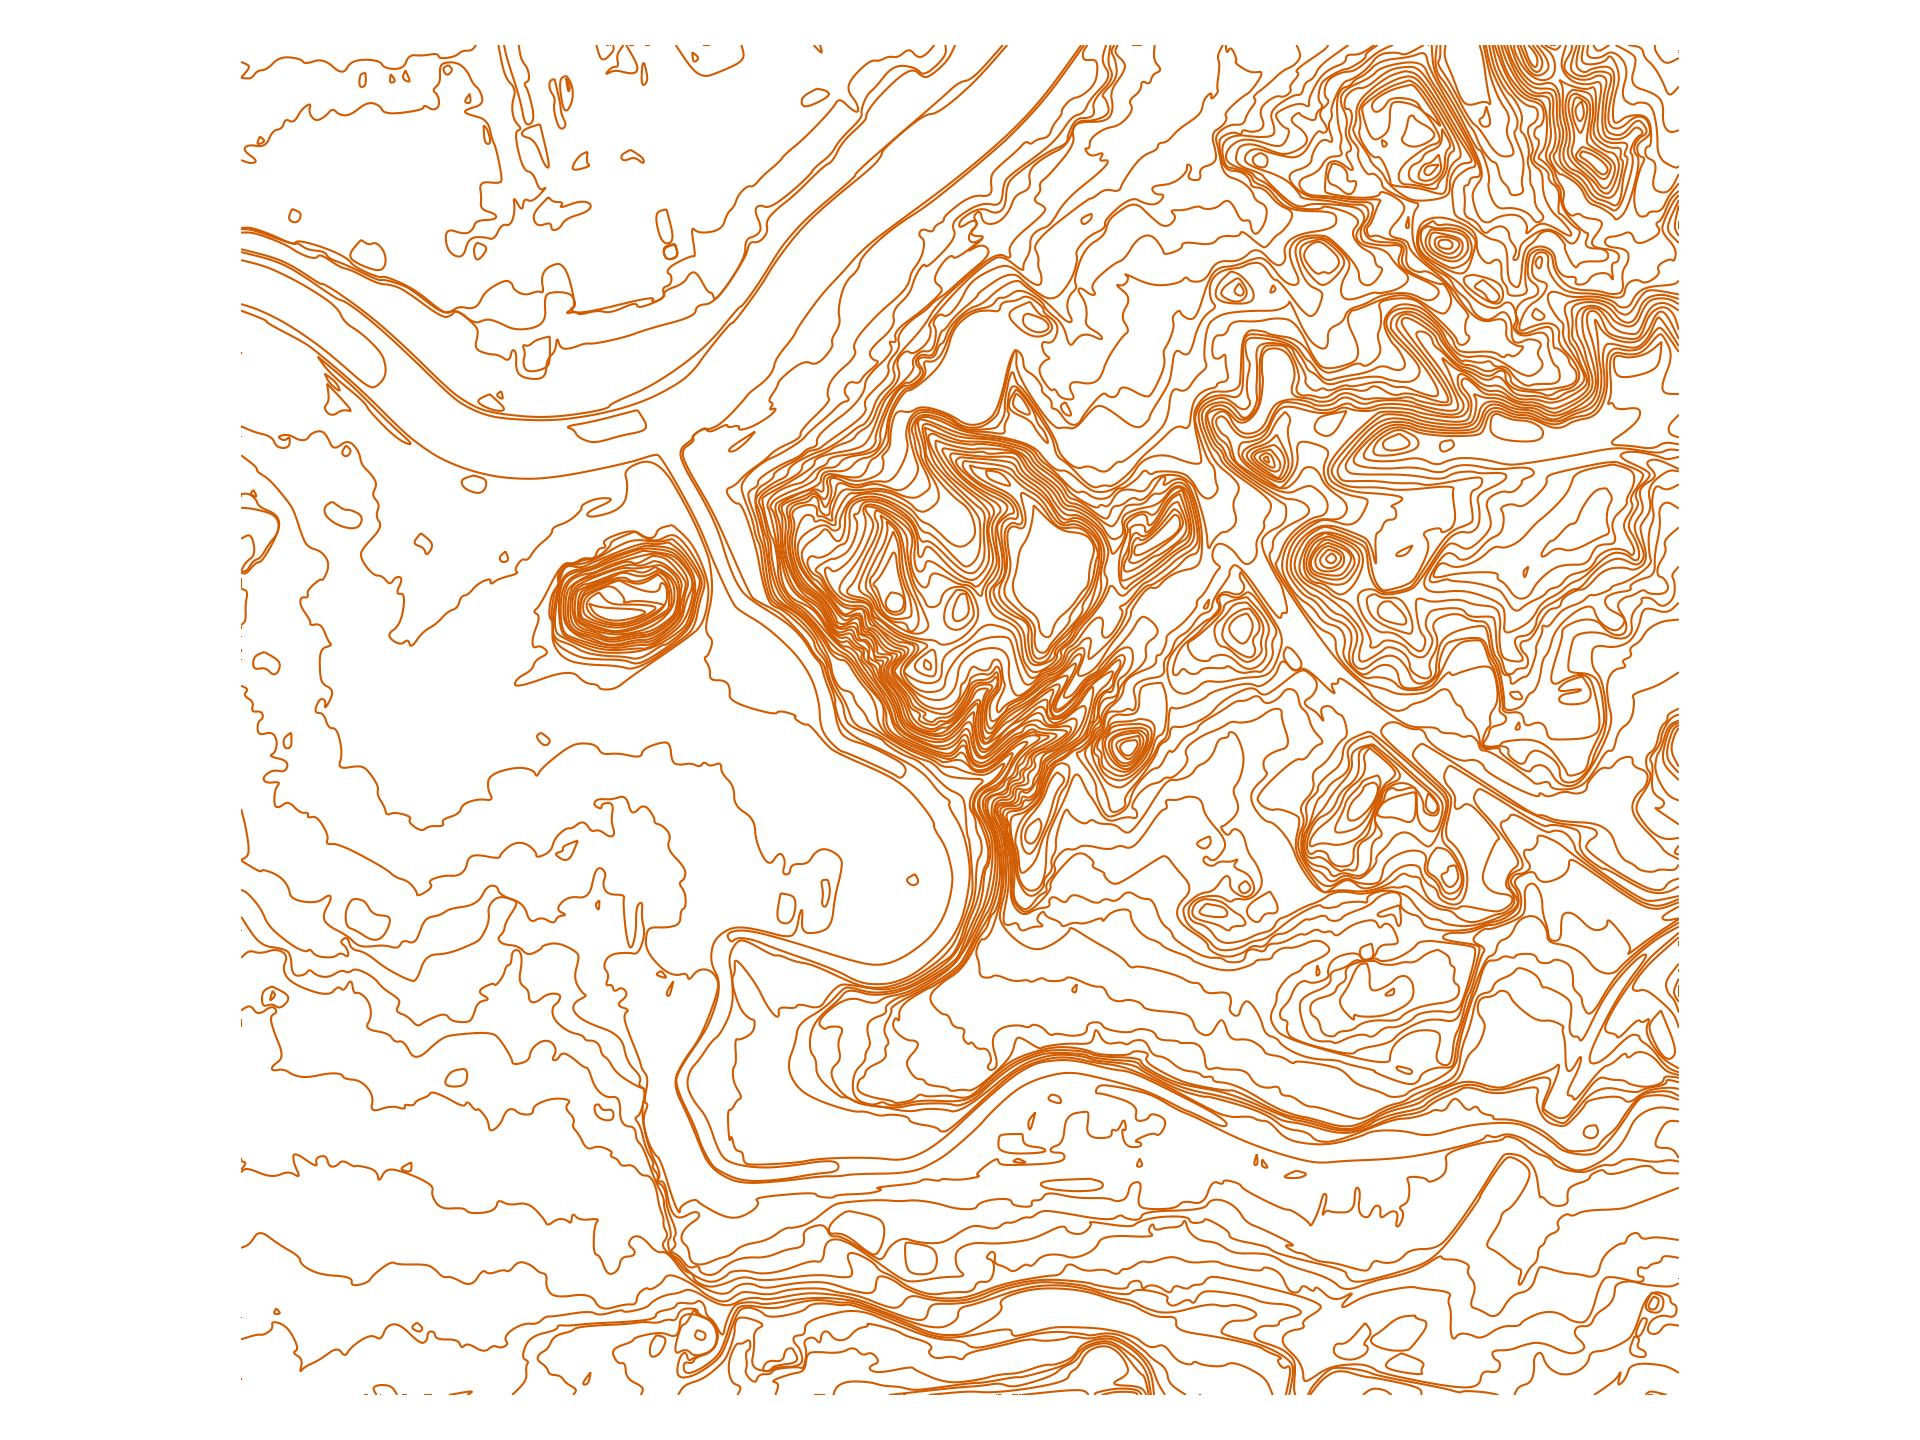
Countour line generator from LIDAR data
|
|
|
|
|
---------------------------------------
|
|
|
|
|
|
2020-12-16 08:52:18 +02:00
|
|
|
This accepts two kinds of contour data:
|
|
|
|
|
|
2020-12-16 09:06:27 +02:00
|
|
|
**2017 variant**: y, x, z, separated by commas:
|
2020-12-16 08:52:18 +02:00
|
|
|
```
|
2020-12-16 09:06:27 +02:00
|
|
|
6062999.75,584000.75,88.07
|
2020-12-16 08:52:18 +02:00
|
|
|
```
|
|
|
|
|
|
2020-12-16 09:06:27 +02:00
|
|
|
Recommended whenever available. It is more dense, gridded (thus much faster),
|
|
|
|
|
but not available outside major cities.
|
2020-12-16 08:52:18 +02:00
|
|
|
|
2020-12-16 09:06:27 +02:00
|
|
|
**2009 variant**: x, y, z, separated by one or more spaces:
|
2020-12-16 08:52:18 +02:00
|
|
|
```
|
2020-12-16 09:06:27 +02:00
|
|
|
501991.670 6150000.000 57.689
|
2020-12-16 08:52:18 +02:00
|
|
|
```
|
|
|
|
|
|
2020-12-16 09:06:27 +02:00
|
|
|
**Non-gridded**, therefore significantly slower (`gdal_grid` must be used
|
|
|
|
|
before making contours, which is slow). However, available throughout the
|
|
|
|
|
country.
|
2020-12-16 08:52:18 +02:00
|
|
|
|
2020-12-16 09:06:48 +02:00
|
|
|
Usage
|
|
|
|
|
-----
|
2020-12-11 10:44:26 +02:00
|
|
|
|
2020-12-16 08:52:18 +02:00
|
|
|
1. Download contour lines to zip files in this directory.
|
|
|
|
|
2. Adjust `BOUNDS` and `VARIANT` in `config.mk`.
|
2020-12-11 10:44:26 +02:00
|
|
|
3. Run `make -j$(nproc) smooth_<X>.gpkg`. This will output a geo-package with
|
|
|
|
|
contour lines every `X` meters. X can be fractional (e.g.
|
|
|
|
|
`smooth_2.5.gpkg`).
|
2020-12-11 11:10:12 +02:00
|
|
|
4. Optional: you may generate a raster image with `layer2img.py`.
|
2020-12-11 10:44:26 +02:00
|
|
|
|
2020-12-16 08:52:18 +02:00
|
|
|
Dependencies for a Linux system:
|
2020-12-11 10:44:26 +02:00
|
|
|
|
2020-12-16 08:52:18 +02:00
|
|
|
- docker
|
|
|
|
|
- psql (client only)
|
2020-12-11 10:44:26 +02:00
|
|
|
- gdal-bin
|
|
|
|
|
- unzip
|
2020-12-16 08:52:18 +02:00
|
|
|
- awk
|
2020-12-11 10:46:46 +02:00
|
|
|
|
2020-12-11 11:25:41 +02:00
|
|
|
Example
|
|
|
|
|
-------
|
|
|
|
|
|
|
|
|
|

|
|
|
|
|
|
2020-12-11 10:46:46 +02:00
|
|
|
License
|
|
|
|
|
-------
|
|
|
|
|
|
|
|
|
|
Code in this directory is public domain.
|